COVID negative even with a postive at-home test? | A Bayesian view
I exhibited COVID-19 symptoms in April of 2022 after having visited a friend who later tested positive. Two negative results using the iHealth COVID-19 Antigen Rapid Test on different days seemed to indicate I was in the clear. The corresponding box stated a single positive test was sufficient to at least flag someone for further testing. This lead me to ask the question: what is the probability of having COVID if one tests positive for it?
I found FDA documentation indicating 94.3% of those with positive tests actually had COVID, at least according to a "comparator" method. However, this value was from a single study using only a small sample of 139 individuals. I decided to take the underlying data from the study and estimate MY confidence in the results using Bayesian estimation.
Here are the resulting (i.e. positive/negative) combinations from both the iHealth and comparator tests along with their raw counts and the corresponding true/false positive/negative type:
| iHealth | comparator | count | type |
|---|---|---|---|
| + | + | 33 | true positive |
| + | - | 2 | false positive |
| - | - | 102 | true negative |
| - | + | 2 | false negative |
There were 35 positive iHealth results with 33 of them having positive comparator results, resulting in the above ~94.3% value (33/35). This value is also known as precision among machine learning enthusists.
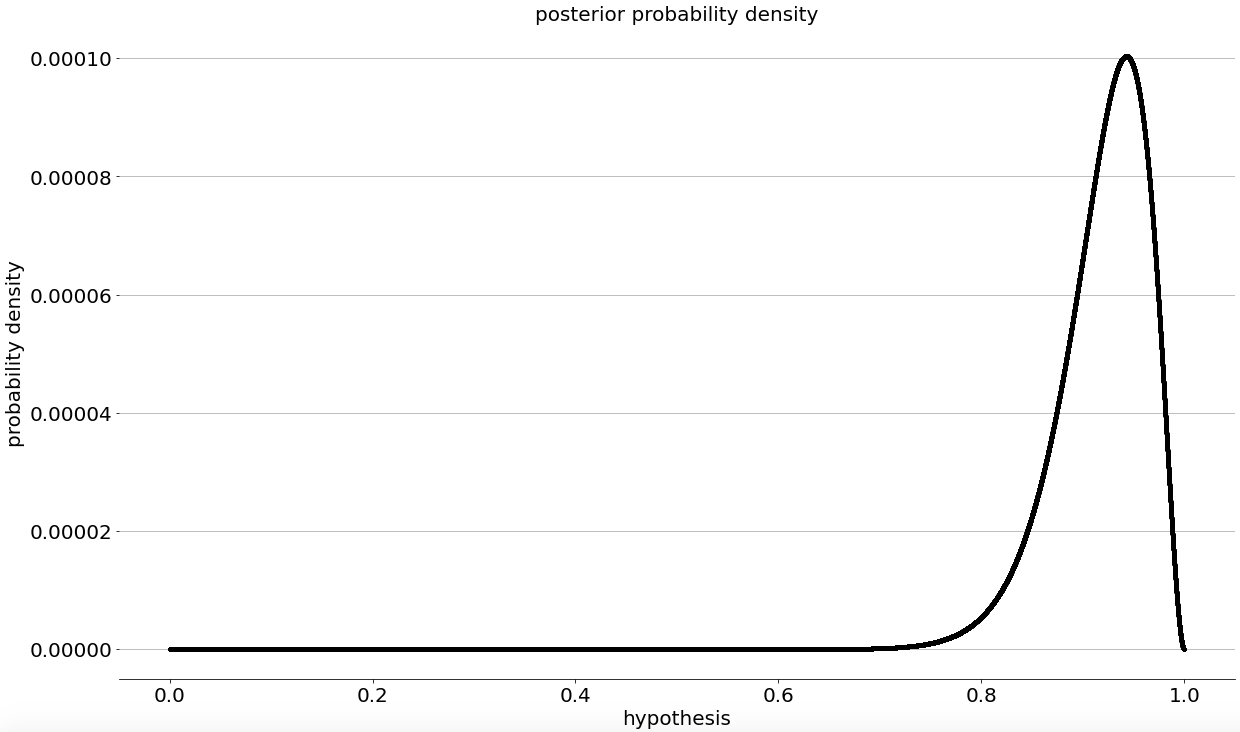
I don't have an intuition for how well these tests should perform so, I'm going to assume the probability of the test precision being any value between 0% to 100% as being equally likely (i.e. flat prior). Updating these values using a binomial likelihood for 33 matching and 2 non-matching test results, according to Bayes' Theorem, results in this posterior distribution:

The peak or Maximum a Posterior (MAP) value is the same ~94.3% value from the iHealth documentation with a 90% confidence or credible interval of 83.5% (5th percentile) to 97.7% (95th percentile).
This range is wider than that implied by seeing the 94.3% value in isolation. 94.3% is equivalent to roughly 1-in-18 positive tests being incorrect. The credible interval corresponds to roughly 1-in-6 to 1-in-43 incorrect test results, which are quite different values.
I've included these results in the top line of the table below along with the MAP and credible interval upper and lower bounds. These same values, using the above count data and the same methodology, are included for the other combinations of iHealth and comparator test results:
| iHealth | actual/comparator | MAP (%) | CI_lb (%) | CI_ub (%) |
|---|---|---|---|---|
| + | + | 94.3% | 83.5% | 97.7% |
| + | - | 5.7% | 2.3% | 16.3% |
| - | - | 98.1% | 94.1% | 99.2% |
| - | + | 1.9% | 0.8% | 5.9% |
One thing that stands out to me is, I'm much more confident in being COVID negative with a negative test. I think this is because there are nearly 3 times as many actually negative trial participants (104) as positive ones (35) and the same amount of negative iHealth results. Said another way, there is simply more data for negative cases so we should be more confident.
Conversely, we're less confident in being negative given a positive iHeath result since there is so little data. The same is also true about being positive if one has a negative test result.
Anyways, I hope you found this interesting. The methodology I've used is from the Estimating Proportions chapter of Think Bayes 2, which has a lot more detail. It's been a great resource and I highly recommend it!