Using Bayesian estimation to decide the best Spring Stardew Valley crop to plant your second year
The realization
I had been eyeing Stardew Valley for a while and finally started playing it.
After planting a variety of crops and going through my first harvest, I noticed I was obtaining different amounts and qualities of crops. For instance, harvesting a potato plant can yield 1, 2, or 3 (possibly more) potatoes and each potato can be either regular, silver, or gold quality. I have seen a fourth quality (i.e. iridium) for other items but not for any of the Spring crops I'll discuss.
At this point I realized that these kinds of factors and others would result in ranges/distributions of revenue and profit instead of a single value.
The question
Once I realized each crop has a distribution of potential profits, I wondered how I could use
statistics to make Stardew Valley ACTUALLY fun decide what to plant to make the most profit?
My approach
The main metric I'll focus on is profit-per-square (of land) per year. The reason is the main exhaustable resource, that I've encountered so far at least, is land.
Profit is revenue minus expenses.
Yearly expenses are constant for each product/crop, at least for the Spring crops I'm focusing on. They are determined by the number of harvests and the cost of seeds (i.e. at Pierre's).
Revenue can vary due to quality and, potentially, because more than one item can result from each pull or harvest of a plant. Hence, the statistical focus of this article will be on determining the distribution of yearly revenue and then subtracting the yearly expenses from each potential revenue value to obtain the corresponding yearly profit distribution.
Most of the crops I'll analyze vary only in quality and are thus easier to build revenue distributions for. There are 2 crops (i.e. potatoes and unmilled rice) that vary in both quality and items upon harvest.
Here is an overview of the steps I'll take to derive profit-per-square per year distributions for each Spring crop:
- Collect quality and, if applicable, items upon harvest counts
- Obtain, if applicable, the items upon harvest distribution using those counts and a Bayesian statistical technique
- Obtain the quality distribution using a Bayesian statistical technique
- Obtain the price distribution from the quality distribution and the corresponding quality prices
- Obtain the revenue per harvest distribution by combining the items per harvest and price distributions
- Calculate the number of harvests per year using using the days until first harvest
- Obtain the revenue per year distribution using the revenue per harvest distribution and number of harvests.
- Calculate the expenses per year using the number of harvests per year and seed cost
- Obtain the distribution of profit per year using the revenue per year distribution and the yearly expenses.
Note that this process includes an assumption that the quality and count distributions are independent, meaning the number of items upon harvest does not affect the chance of those items having different qualities. This is based on some analysis of the data I collected and realizing I don't have enough data to say either way and my assumption that coding sampling of independent probabilities is easier than coding sampling of a joint distribution. Hence, I will derive the quality and count distributions separately for these multi-item crops.
Once I've obtained the profit-per-square per year distributions I can compare them to figure out the most profitable crop(s).
The data I collected
I planted blue jazz, cauliflower, garlic, potatoes, rice, kale, parsnips, and tulips and made sure they were watered everyday and protected from birds by scarecrows.
I then harvested them and recorded quality and count data for each harvest for the full Spring growing season. Here are the final yearly counts of the different item qualities:
| item | quality | count |
|---|---|---|
| blue_jazz | regular | 15 |
| blue_jazz | silver | 11 |
| blue_jazz | gold | 7 |
| cauliflower | regular | 87 |
| cauliflower | silver | 71 |
| cauliflower | gold | 39 |
| garlic | regular | 67 |
| garlic | silver | 28 |
| garlic | gold | 24 |
| kale | silver | 13 |
| kale | regular | 12 |
| kale | gold | 7 |
| parsnip | regular | 27 |
| parsnip | silver | 23 |
| parsnip | gold | 15 |
| potato | regular | 25 |
| potato | silver | 13 |
| potato | gold | 5 |
| tulip | silver | 14 |
| tulip | regular | 13 |
| tulip | gold | 6 |
| unmilled_rice | silver | 14 |
| unmilled_rice | regular | 12 |
| unmilled_rice | gold | 6 |
Unmilled rice and potatoes were the multi-item harvest crops. Here are the item counts upon harvest for them:
| item | item_per_harvest | count |
|---|---|---|
| potato | 1 | 33 |
| potato | 2 | 6 |
| potato | 3 | 2 |
| unmilled_rice | 1 | 27 |
| unmilled_rice | 2 | 3 |
I also kept track of the days until the first harvest, the initial investment (seed cost), and the prices of regular, silver, and gold quality versions of each item in Pierre's store:
| item | days_til_first_harvest | initial_investment | regular | silver | gold |
|---|---|---|---|---|---|
| blue_jazz | 7 | 30 | 50 | 62 | 75 |
| cauliflower | 12 | 80 | 175 | 218 | 262 |
| garlic | 4 | 40 | 60 | 75 | 90 |
| potato | 6 | 50 | 80 | 100 | 360 |
| unmilled_rice | 8 | 40 | 30 | 37 | 45 |
| kale | 6 | 70 | 110 | 137 | 165 |
| parsnip | 4 | 20 | 35 | 43 | 52 |
| tulip | 6 | 20 | 30 | 37 | 45 |
How I obtained the distribution of item counts upon harvest
I imagined the process the game developer used to choose the number of items upon harvest as, starting with a guaranteed first item, choosing a random number between 0 and 1, determining if that number is within a range of values that decides whether another item is drawn, and continuing this process until the latest random number is not in the extra item draw range.
I considered 2 other processes: 1) choosing an average item count upon harvest and sampling from a Poisson distribution and 2) hard-coded probability ranges for each item count upon harvest value. The first method seemed too into the statistical weeds for a single game developer with no other employees. The second constrained me to the data I had collected thus far (i.e. no more than 3 items could be harvested). I suspect more than 3 items might be possible and the method I did go with seemed like the easiest to code for the developer.
After a lot of consideration, I decided to model the counts using a geometric distribution with a modification: I subtracted 1 from the exponent of the success class probability (i.e. new item is drawn), to reflect that we already have 1 item at the start.
To estimate the range of values of this, presumably hard-coded, extra item draw chance I assumed a flat prior distribution between 0 and 1 and the modified geometric likelihood. Following Baye's theorem I multiplied the equal probability vector of the prior by a vector representing the probability of each item count upon harvest, assuming the modified geometric form of the likelihood, until I had exhausted the data.
Heres the resulting posterior distribution, representing the probability of an extra draw that is consistent with the data for potatoes:
The 94% credible interval for the extra potato draw chance ranges from 11.4 to 32%.
This posterior distribution can be used, with the modified geometric distribution, to build the posterior predictive distribution, which is the probability of future items upon harvest data given the data encountered so far.
It's calculated by taking each extra draw chance value from the gridded posterior distribution, building the corresponding probability of different items upon harvest using the modified geometric distribution, and forming the sum of these weighted by the corresponding draw chance probability.
Heres the result for potatoes:
This matches well with the count data that I collected.
How I obtained the distribution of qualities
Thankfully, qualities have only four values: regular, silver, gold, and iridium. I've only encountered three for the Spring crops I've encountered so far so, I'll just ignore iridium until I encounter it in future data.
I prefer starting with simple gridded approaches if possible. Since the probabilities must sum to one I really only need to iterate over two them.
For the Bayesian update I'll assume the data follows a multinomial distribution. This is equivalent to sampling from a bag with 3 different colors of marbles with replacement.
Since I don't have any idea what the quality values should be I'll just use a flat prior again. This distribution consists of the same probability for all combinations of draw chances for regular, silver, and gold qualities that sum to one.
I used Bayes Theorem to update this prior with a similarly structured likelihood joint distribution, for all of the same quality draw chance combinations, but with the probability of the observed quality counts, as dictated by the multinomial distribution. Here's the resulting posterior distribution for potatoes:
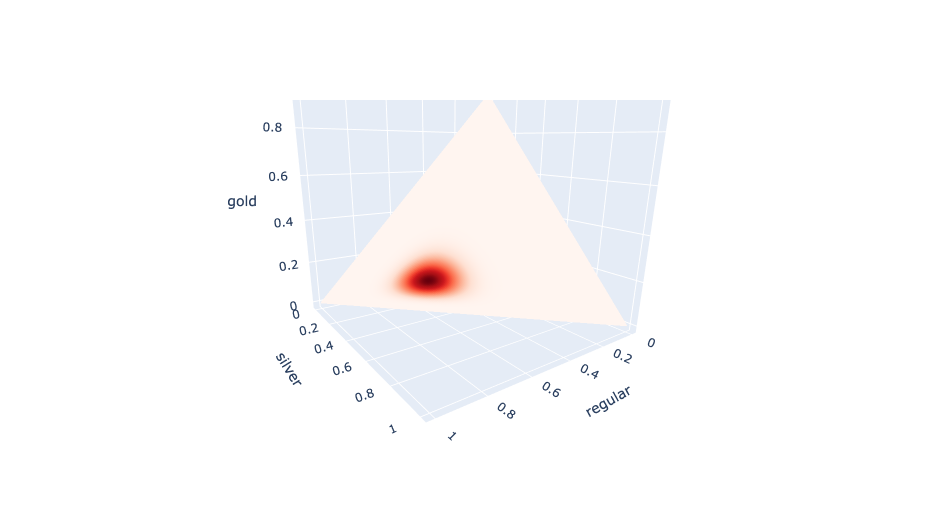
The darker red means a higher probability for that combination of draw chances for regular, silver, and gold qualities.
I multiplied each of these quality probability distributions/points by the corresponding probability of it (i.e. the value represented by the red color) and summed them to obtain the distribution of qualities (i.e. the posterior predictive). Here's the version for potatoes:
Again this is close to the data.
How I obtained the distribution of revenue upon harvest
Now I need to combine the quality-based price distribution (i.e. the quality distribution but with the qualities replaced with their corresponding price) and that for the item counts upon harvest to obtain that for the revenue per harvest.
To do this, I need to build the revenue distribution for each potential item harvest count in that item's count per harvest distribution, weight it by the probability of that count, and then sum all of them.
For example, to build the revenue distribution for 2 items harvested, we can take the sum of all potential price combinations between a price distribution and itself and multiply the corresponding probabilities. This will sometimes result in duplicate revenues. In these cases the duplicate probabilities will be added so there is only one instance of each revenue.
If we wanted to extend this scenario to 3 items per harvest we would keep the resulting revenue distribution for 2 items per harvest and perform the same process with it and another of the original price distributions. This process can be repeated to obtain the revenue distribution for any number of items per harvest.
Here's the potato revenue per harvest distribution:
The patterns make sense to me. 80 gold per harvest, corresponding to 1 regular potato, is the most likely by far. Next is 1 silver potato (100 gold) then 1 gold potato (360 gold).
I want to point out that I've cut off this figure drastically, since it ranges from 80 (1 regular potato) to 3600 gold (10 gold potatoes) and the probabilities above 520 are negligible.
Calculating the number of harvests per year
The number of harvests per year is required to use the revenue per harvest distribution to calculate the revenue per year.
Harvests per year is equivalent to the number of harvest/mature/plant periods in the days remaining after the first plant/mature period plus an additional harvest for any remaining partial harvest/mature/plant period over the entire growing/harvesting season. This can also vary depending on whether the plant is destroyed upon harvest and/or whether it is never destroyed (like the fruit trees I've encountered).
If this isn't clear enough I've implemented a function in the corresponding section of the notebook on Github.
Turns out that the number of harvests per year for potatoes is 3.
Calculating the revenue per year distribution
The same process used to calculate the revenue per harvest for a specific item per harvest count is used to calculate the revenue per year distribution. First, the summed distribution is calculated for 2 harvests using the revenue per harvest distribution by summing all combinations of revenues and multiplying the corresponding probabilities, then instances of the same revenue have their probabilties summed. This process is repeated using this new distribution with the original revenue per harvest distribution for the number of harvests.
Here's the revenue per year distribution for potatoes:
I cut off the figure at 1100 gold because it goes all the way to 10800 (10 gold potatoes for all 3 harvests)!
Oddly enough, harvesting 3 regular potatoes (240 gold) appears to be less likely than 2 regular and 1 silver (260 gold). I suspect something is happening akin to 2 of a kind is more likely than 3 of a kind in Poker. It is true that regular potatoes are more probable than gold. So, this analogy breaks down a bit. However, I did some completely different sampling simulations and, basically, obtained the exact same distribution. Hence, I have high confidence in the result.
Obtaining the profit per year distribution
Profit is revenue minus expenses. Basically we just need to calculate the expenses for every crop and subtract that from each of the revenue values in the yearly revenue distributions.
For these simple crops the expense is, simply, the seed cost or initial investment times the number of harvests.
I calculated all of the profit distributions for all crops and visualized their cumulative distribution functions (CDFs), obtained by ordering by the profit and summing all probabilities up until that point:
For those unfamiliar with CDFs, they represent the sum of all probabilities up until the value on the x-axis, in this case profit. Note how the y-axis ranges from 0 to 1, since the total probability of everything is 1 (100%). I find it is easier to visualize multiple probability distributions, especially those that aren't continuous this way.
I cut the figure off at 1000 gold for better visibility. Unmilled rice's distribution actually extends all the way to 1230 and that for potatoes extends to 10650 gold.
One thing that immediately stands out to me is that there is a good chance unmilled rice is unprofitable (~62.3% chance). Now, I'm aware that certain items can be converted to other products (e.g. cherries to cherry wine). Though I don't seem to have access a new product trasnformation for unmilled rice yet.
There appears to be a clear hierachy of unmilled_rice < tulip < blue_jazz. The hierarchy is less clear after that.
The main contenders for highest profit are potatoes, cauliflower, and kale.
One way to make a decision about what crop to plant is to derive the probability that the profit distribution of one crop is higher than another, what I've read referred to as the "probability of superiority".
To calculate this for two discrete distributions, we simply iterate through all pairs of hypotheses or profit values, multiply their probabilities (because this is the probability that they're both drawn together), filter to only the instances where the expected higher distribution's profit value is higher than the other one, then sum them together.
Here are the fractional probabilities of superiority for all pairs of the top contender crops: