Tears of the Kingdom Zonai device draw chances for every dispenser
What are Zonai devices and their dispensers?
There are Zonai device dispensers all throughout Hyrule in The Legend of Zelda: Tears of the Kingdom. Each dispenser can output any of 3 to 6 unique items, which can be glued together to build contraptions to help you navigate the world (e.g. hoverbikes), solve puzzles, and such. For instance, one could make a car using 4 small wheels, some sort of plank, and a steering stick.
The best dispensers for every device aren't published
Each device dispensed has a, probably hard-coded, percent chance of being drawn. To my knowledge, these percent chances haven't been published. Knowing these percentages could help identify the best dispenser to visit to obtain more of a desired item.
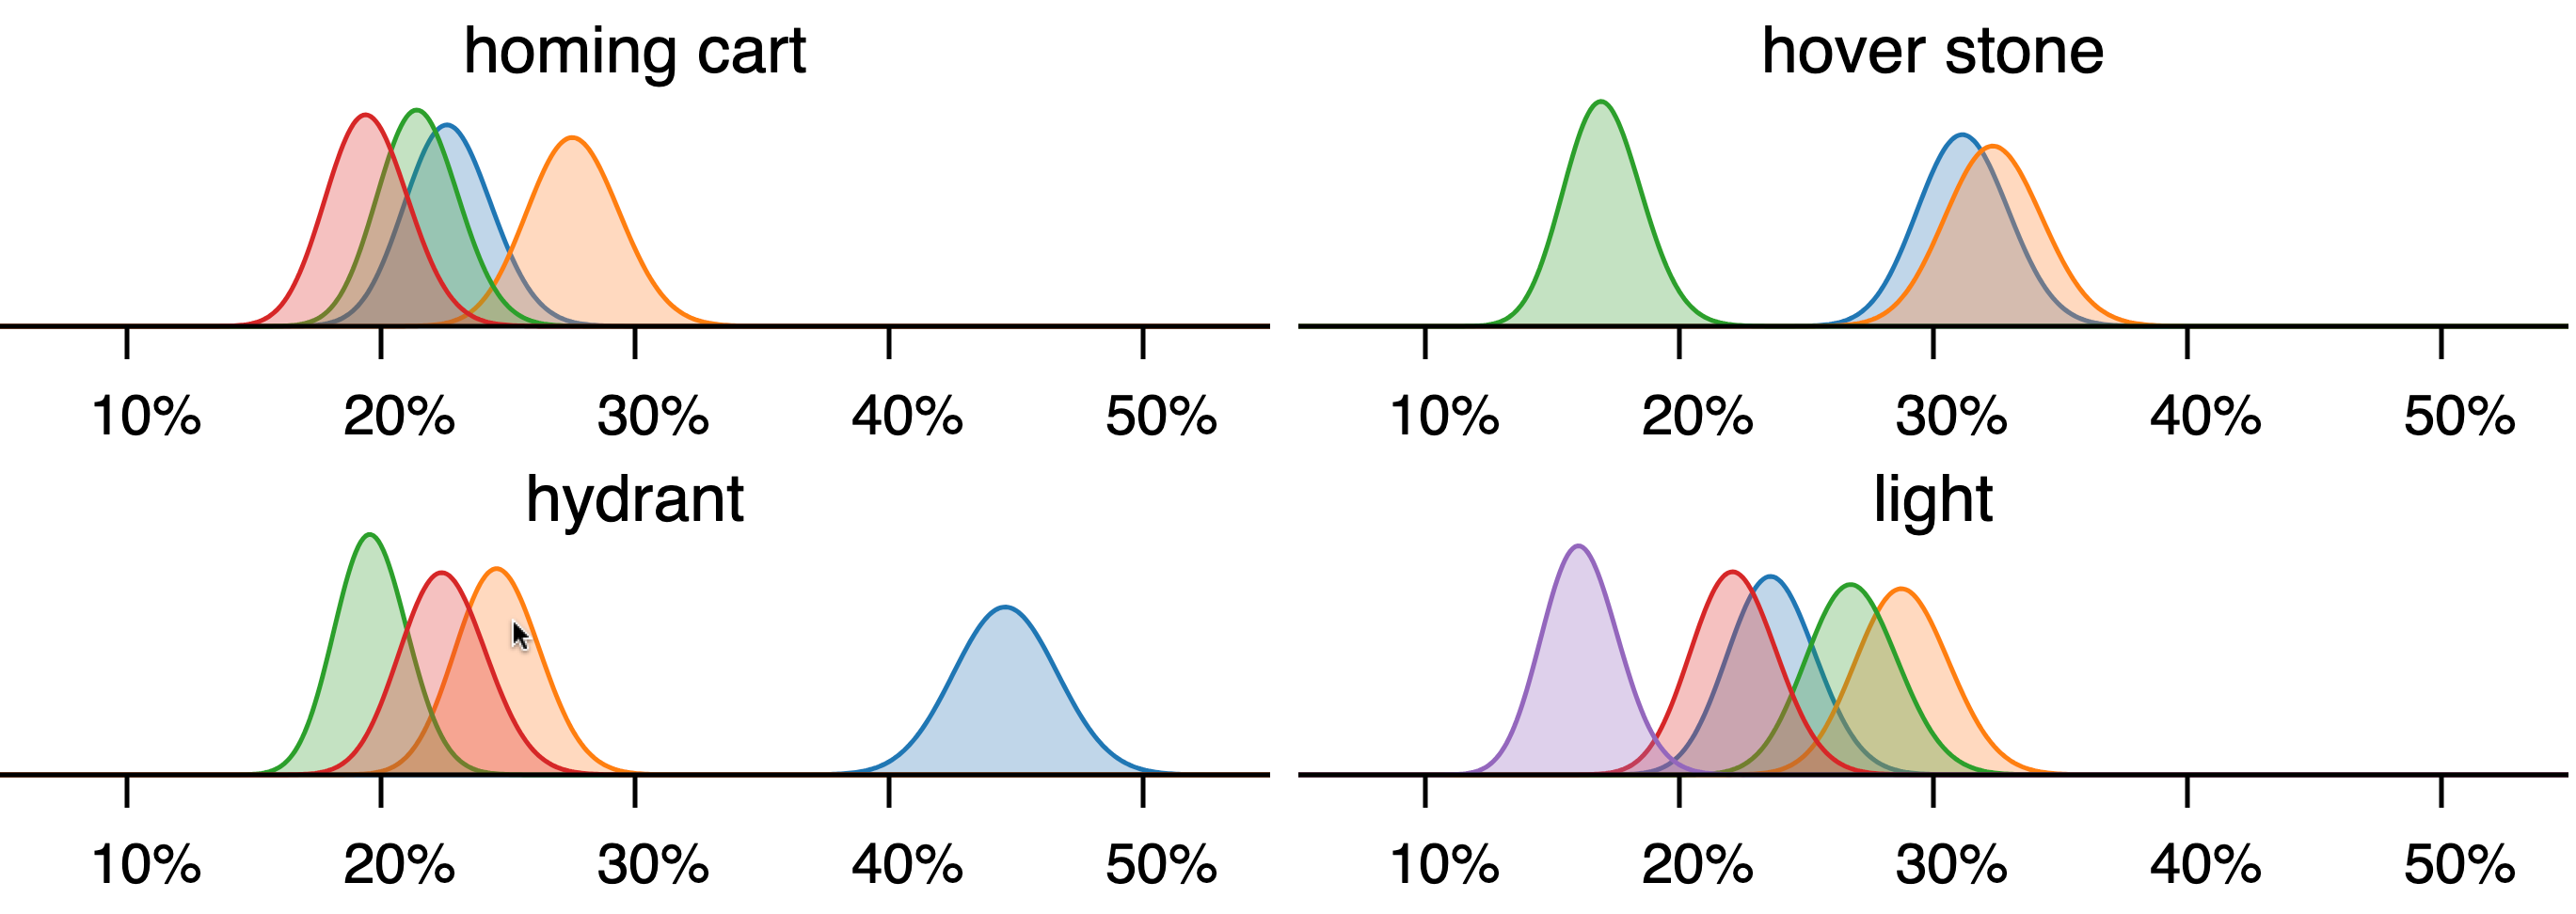
Use the graphs below to find the best/worst dispensers for each item
The graphs below solve this problem by showing the distribution of percent chance values of drawing a particular item (in the title) from a particular dispenser (given by the color), consistent with item count data I collected.
Tutorial
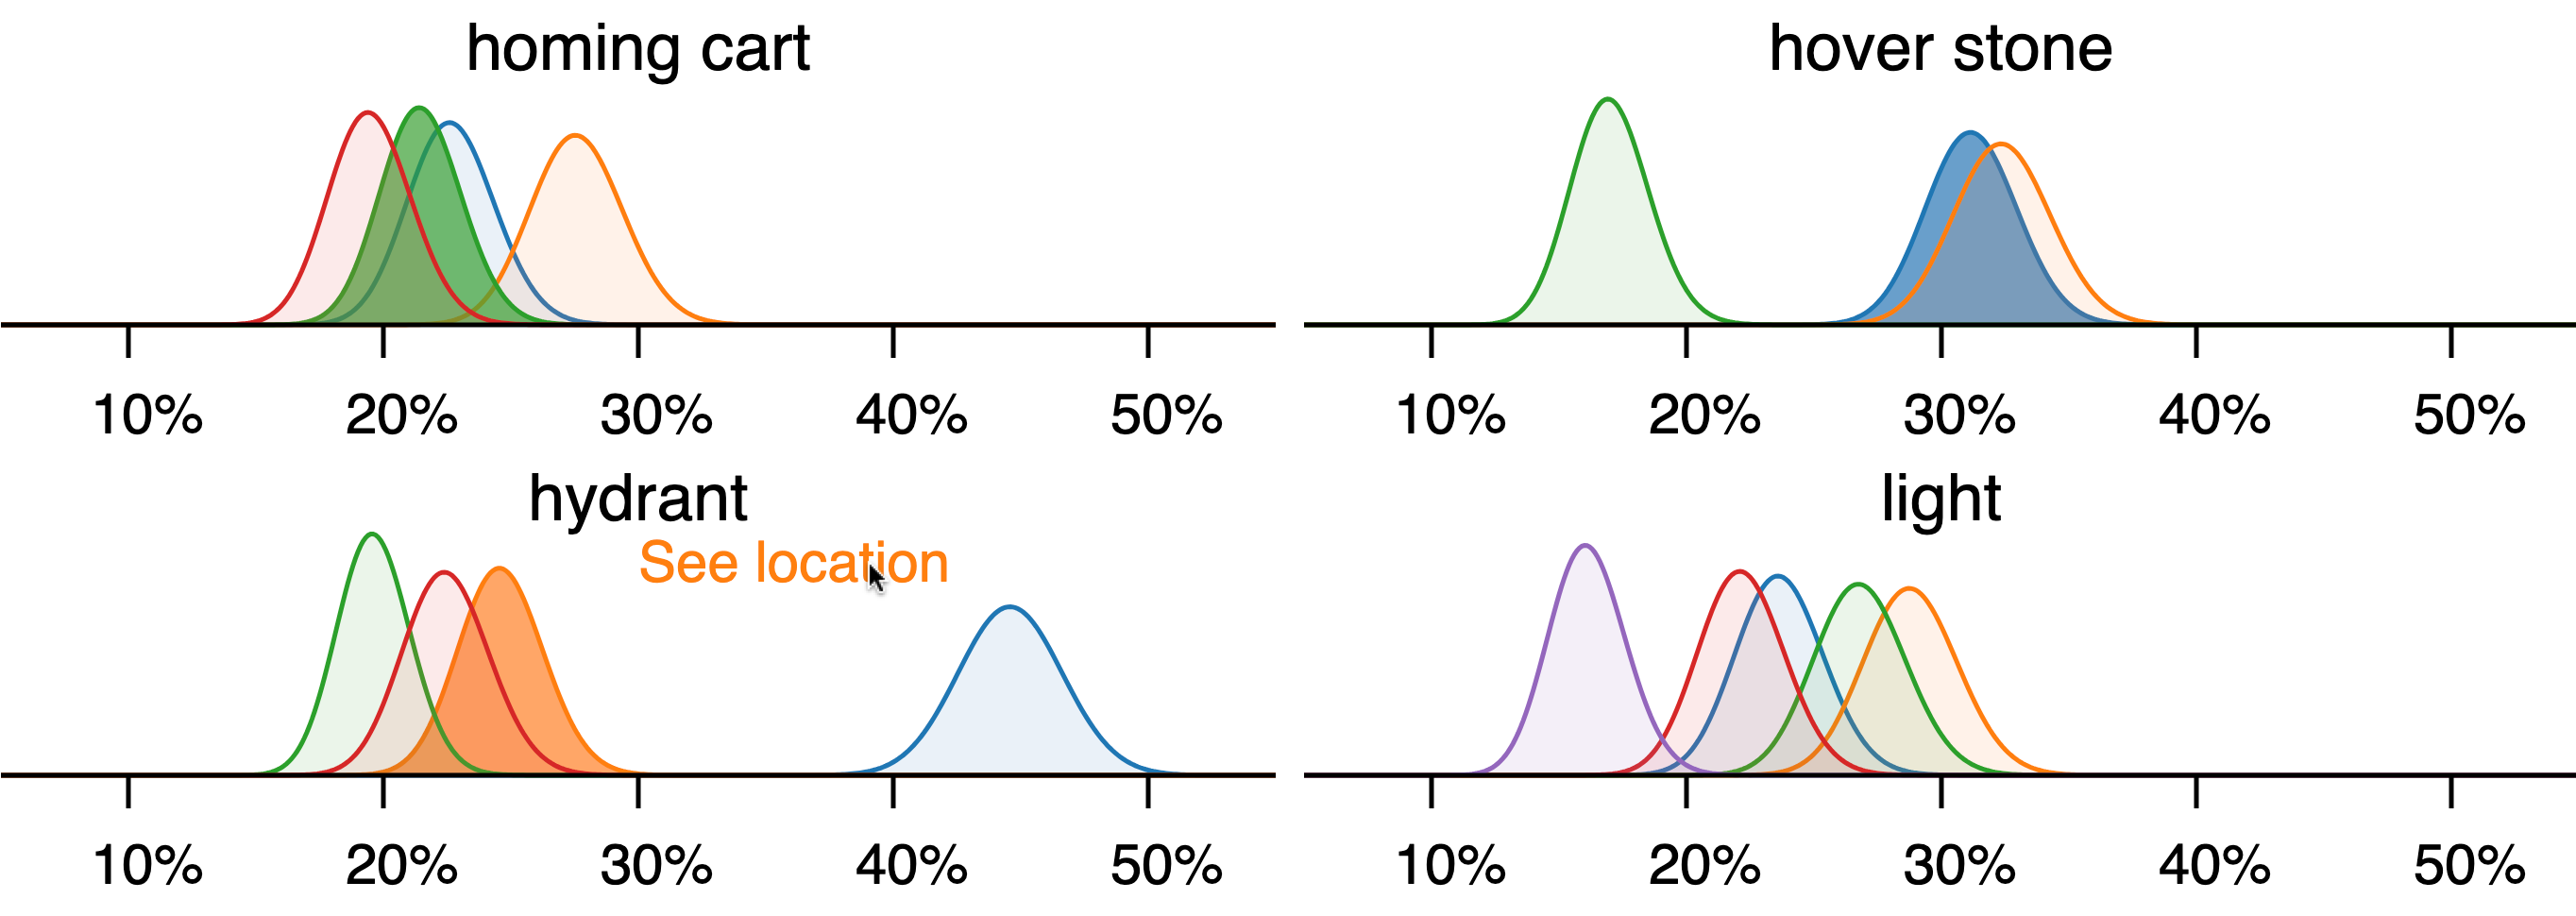
1) Click on dispenser item draw chance distribution to ...

... highlight that dispenser's curves for all of its items.

2) Click on link of same color as original curve you clicked on to open new tab at Zelda Dungeon dispenser location and zoom in/out to get more context for its location!

The app
What are these distributions technically and how to did I build them?
I visited every known dispenser, saved my game, added 5 large Zonai charges (gives maximum items), counted the number of each device, and reloaded my game. I repeated this 10 times for every device. I then took this data and used a Bayesian statistical method to compute the distributions for the percent chance for every item of every dispenser.
These are distributions instead of single values because a range of hard-coded draw probabilities are compatible with the data I collected.
In Bayesian jargon, these are the marginal posteriors assuming a multinomial likelihood and flat Dirichlet prior.
That last part just means I started assuming every dispenser item had an equal chance of being drawn. The multinomial likelihood part just means I calculated the probability of obtaining those particular item counts assuming there's an infinite number of devices in each dispenser. Another way to think of it is the devices drawn were replaced.
Thankfully, the distribution resulting from combining these two distributions with the data has an analytical (i.e. there's a formula) solution, which are what you see above!
Some other baked-in assumptions
These graphs assume that the item placed in a dispenser doesn't alter the draw probabilities. For example, it's assumed the use of large Zonai charges results in the same item probabilities as those for a construct horn. The same assumption is made for other factors like time of day, whether a Blood Moon is present or not, weapons Link is carrying, clothing he is wearing, etc.
That's it
Thanks for reading and I hope you find them useful!